Surface Tension of Liquids Measured by Pendant Drop Method With Matlab
Introduction
Surface tension of liquids plays a central role in many small-scale interfacial phenomena. For instance, the curvature force which is why small insects can walk on water, the Marangoni flow caused by surface tension gradient, the wet-ability of liquids…
Sometimes you have to get the value of surface tension of liquids without the specific facilities. What should you do?
Here I’ll present you a handy way to get the surface tension of liquids with MATLAB, a series of imaging hardware (a camera and an appropriate lighting source will be better) and a syringe.
Principle
Pendant Drop method was adopted since it’s really simple.
The main process of measuring surface tension by this method is to measure the shape of your objective liquids droplets.
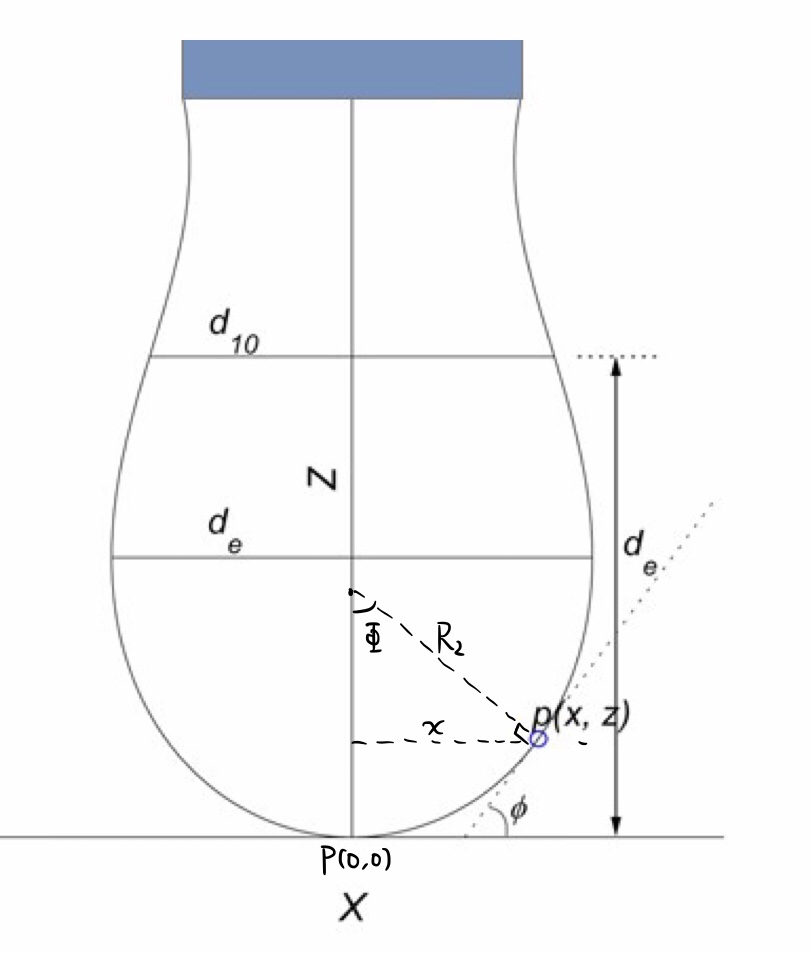
A typical droplet hanging over the nozzle of the syringe is depicted like this:

Specifically speaking, the method adopted here is selected planes method in pendant drop method, which means what you used to get the surface tension is just a few planes in the characteristic droplet shape, not the complete shape curve.
In practice, you have to measure the value of $d_e$, $d_{10}$. After that, you just need to run the script in MATLAB, get the value you need and have fun.
The physical meaning of $d_e$ is the diameter of the maximum horizontal circle of the droplet, while $d_{10}$ means the diameter of the circle located at the height $d_e$ relative to the bottom of the droplet.
Surface tension expressed in terms of $d_e$ and $d_{10}$:
$$\lambda = g\rho{d_e}^2/h$$
where $g$ is the gravitational acceleration, $\rho$ the density of the liquid, $h$ a non-dimensional number associated with $d_e$ and $d_{10}$, which can be easily obtained by looking up in the reference table.
Check this equation with the unit, you can get:
$$m/s^2 * kg/m^3 * m^2 = kg/s^2 = N/(m/s^2)/s^2 = N/m$$
If you want the final value in $dyn/cm$, namely $mN/m$, you should make simple dimensional conversion.
Practical operation
Firstly, you need to get a syringe loaded with the liquid for testing, for example water. Make sure the bubbles in the syringe are negligible. Fix your syringe wherever you like. And push the piston to squeeze the liquid out of the nozzle, please do this carefully to make the droplet hang on the nozzle statically perfectly. Then the imaging should started.
Now it‘s the photo time! You should get a pair of nice camera and lighting source, and take a photo of it normally.
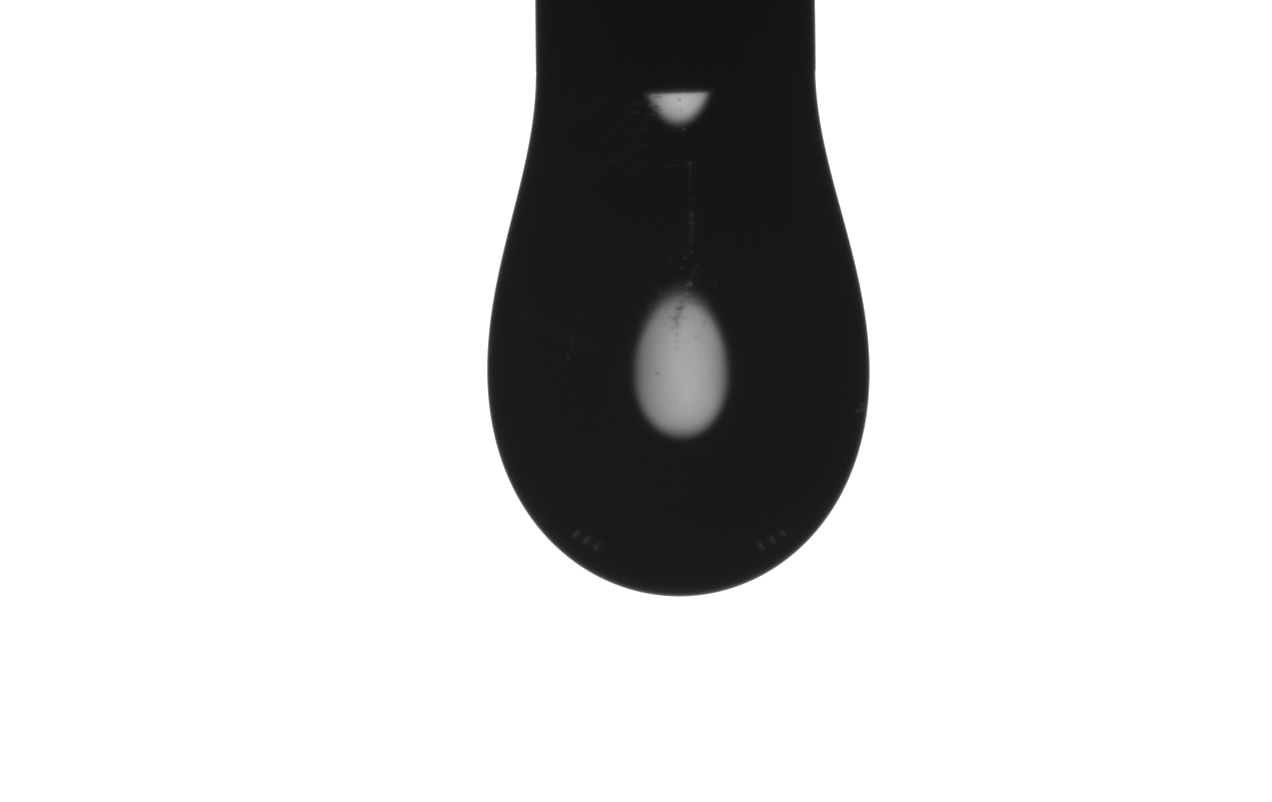
A typical image of the droplet should look like this:

The requirements for imaging listed here:
- The edge should be sharp and clear.
- The nozzle located at the top of the image.
- The amount of the liquid squeezed out of the nozzle, namely the droplet size should ensure $d_{10}/d_e$ is among the range of 0.66 ~ 1. And this ratio should be made more closer to the left limit (0.66) to make the final result more precise. To make this easier, a recommended practice is to largen your nozzle diameter from my experience.
After all these “painful” work, let’s do something much easier, if you think the work above is difficult for you!
- Measure the diameter of the nozzle of the syringe with a vernier scale.
- Find the density of the testing liquid. For most chemicals, it’s easy to get the density on the website, such as BASF.
MATLAB Computation
Here we just put the script for processing the images straightforward.
clear
clc
close all
% define some contant in the experiment
nozzle_diameter = 1.63; % unit: mm
rho = 1060 % unit: kg/m^3
g = 9.80665 % gravitity acceleration unit: m/s^2

imgs = dir('*.png');
for i = 1: numel(imgs)
    %% image process to get the Ds, De, S
    img = imread(imgs(i).name);
    rect = [350, 10, 650, 800];
    img_interested = imcrop(img, rect);
    img_bw = imbinarize(rgb2gray(img_interested),0.4);
    figure
    imshowpair(img_interested, img_bw, 'montage')
    img_bw2 = imfill(~img_bw, 'holes');
    figure
    imshow(img_bw2)
    a = sum(img_bw2, 2);
    a(a==0) = [];
    de = max(a);
    ds = a(length(a)-de);
    s = ds/de;
    ratio = mean(a(1:5))/nozzle_diameter;
    de_length = de/ratio;
    %% compute H by looking up in the database
    load S_H.mat
    h = interp1(S,H,s);
    %% final surface tension calculation [dyn/cm]
    st = g*rho*de_length^2/1000*(1/h)
    sts(i) = st;
end
Here I don’t want to introduce you how to write a MATLAB script. Just give you the script that works.
Put the images you get and the script file in the same folder. Launch the MATLAB, whatever the version is, I used MATLAB 2017. Press F5 to run the script. Wait for a minute, one thing missed. A .mat file should be put in the same folder to make sure the script works normally. This file contains the reference table to calculate the non-dimensional number mentioned above.
So what exactly the script had done when running in MATLAB?
Firstly, it computes the scale of really length and the image pixels. Then compute the real length of $d_e$ according to the scale and the $d_e$ in pixels. Same with $d_{10}$ ($d_s$ in the script). And then their ratio $s$. Then by looking up in the table, we find $h$. Finally, compute the surface tension $st$ based on the equation fore-mentioned. A unit transformation is done to get $st$ in $dyn/cm$.
Notes for attention
The processing of images employs the some simple imaging processing functions in MATLAB. And the parameters in the functions should vary if you your images is different. So when you do not want to understand what the scripts are and how to apply to your images, it ‘s good to make sure your images looks like mine, in the color and size.
The script can process multiple images at the same time, irrespective of the filenames. Also, one liquid should be tested and photoed multiple times for better and convincing results. The results of running the script is shown here:
rho =

        1060


g =

    9.8066


st =

   24.0542


st =

   24.1535


st =

   25.8676


st =

   24.9764
Reference
If you are interested in the mechanism behind the equations here. You are recommended to read following literature.
- S. Fordham, “On the Calculation of Surface Tension from Measurements of Pendant Drops.” Proc. R. Soc. London. Ser. A. A194. 1 (1948).
My Epilogue
Let me tell you a little story. One day, my boss informed me that we need to obtain the surface tension of certain liquids. In case these liquids are polluted or there is something wrong with them, we need to measure them ourselves to ensure that our experiments and data analysis are based on solid proof, even though these liquids have official stated ‘surface tension’ values recorded. So, my first step was to determine whether we had the equipment for this purpose. Then, handling this problem shouldn’t take much effort. As a result, I only found a ‘Contact Angle Measurement Instrument’, which is somewhat similar to what we are looking for. It takes many liquid shape photos on a surface and computes the contact angle through image processing. I also discovered that it has a bundled ‘Surface Tension Measurement Module’, but it costs 2,000 Euros to unlock. Therefore, my choice was to compute the ‘surface tension’ by ourselves to save some money. So, I found the relevant literature and wrote some implementation code. And the final result exceeded my expectations and was basically very close to the official recorded value.
That’s why this post came into being. If you have the same issue as me, I hope it helps.
An out-of-the-box demo has been placed at here. Check it out if you are interested.